
Climate and nature intelligence
Run climate hazard and biodiversity analyses for a mapped property, review strategies and gather nature evidence.
Climate & Nature lets you create an analysis for one of your properties and see two things side by side: the climate hazards the site is exposed to, and the habitats and nature condition inside its boundary. From there you can explore strategies, start projects and collect evidence for nature reporting.
Parts of this area are add-ons or are switched on per organisation. If you cannot see a page or section described here, it may not be enabled for your organisation — ask your tese.io contact.
Where to find it
In the sidebar, open CN Intelligence. It contains:
Climate & Nature – your list of analyses and each property's dashboard.
Climate Impact – the financial view of climate risk (see the Climate Impact page in this section).
Climate Adaptation Plan – opens the separate Climate Adaptation Plan application in a new place.
Tools – CN Tools, and, on some organisations, Data Bridge and Nature Context.
How to create an analysis
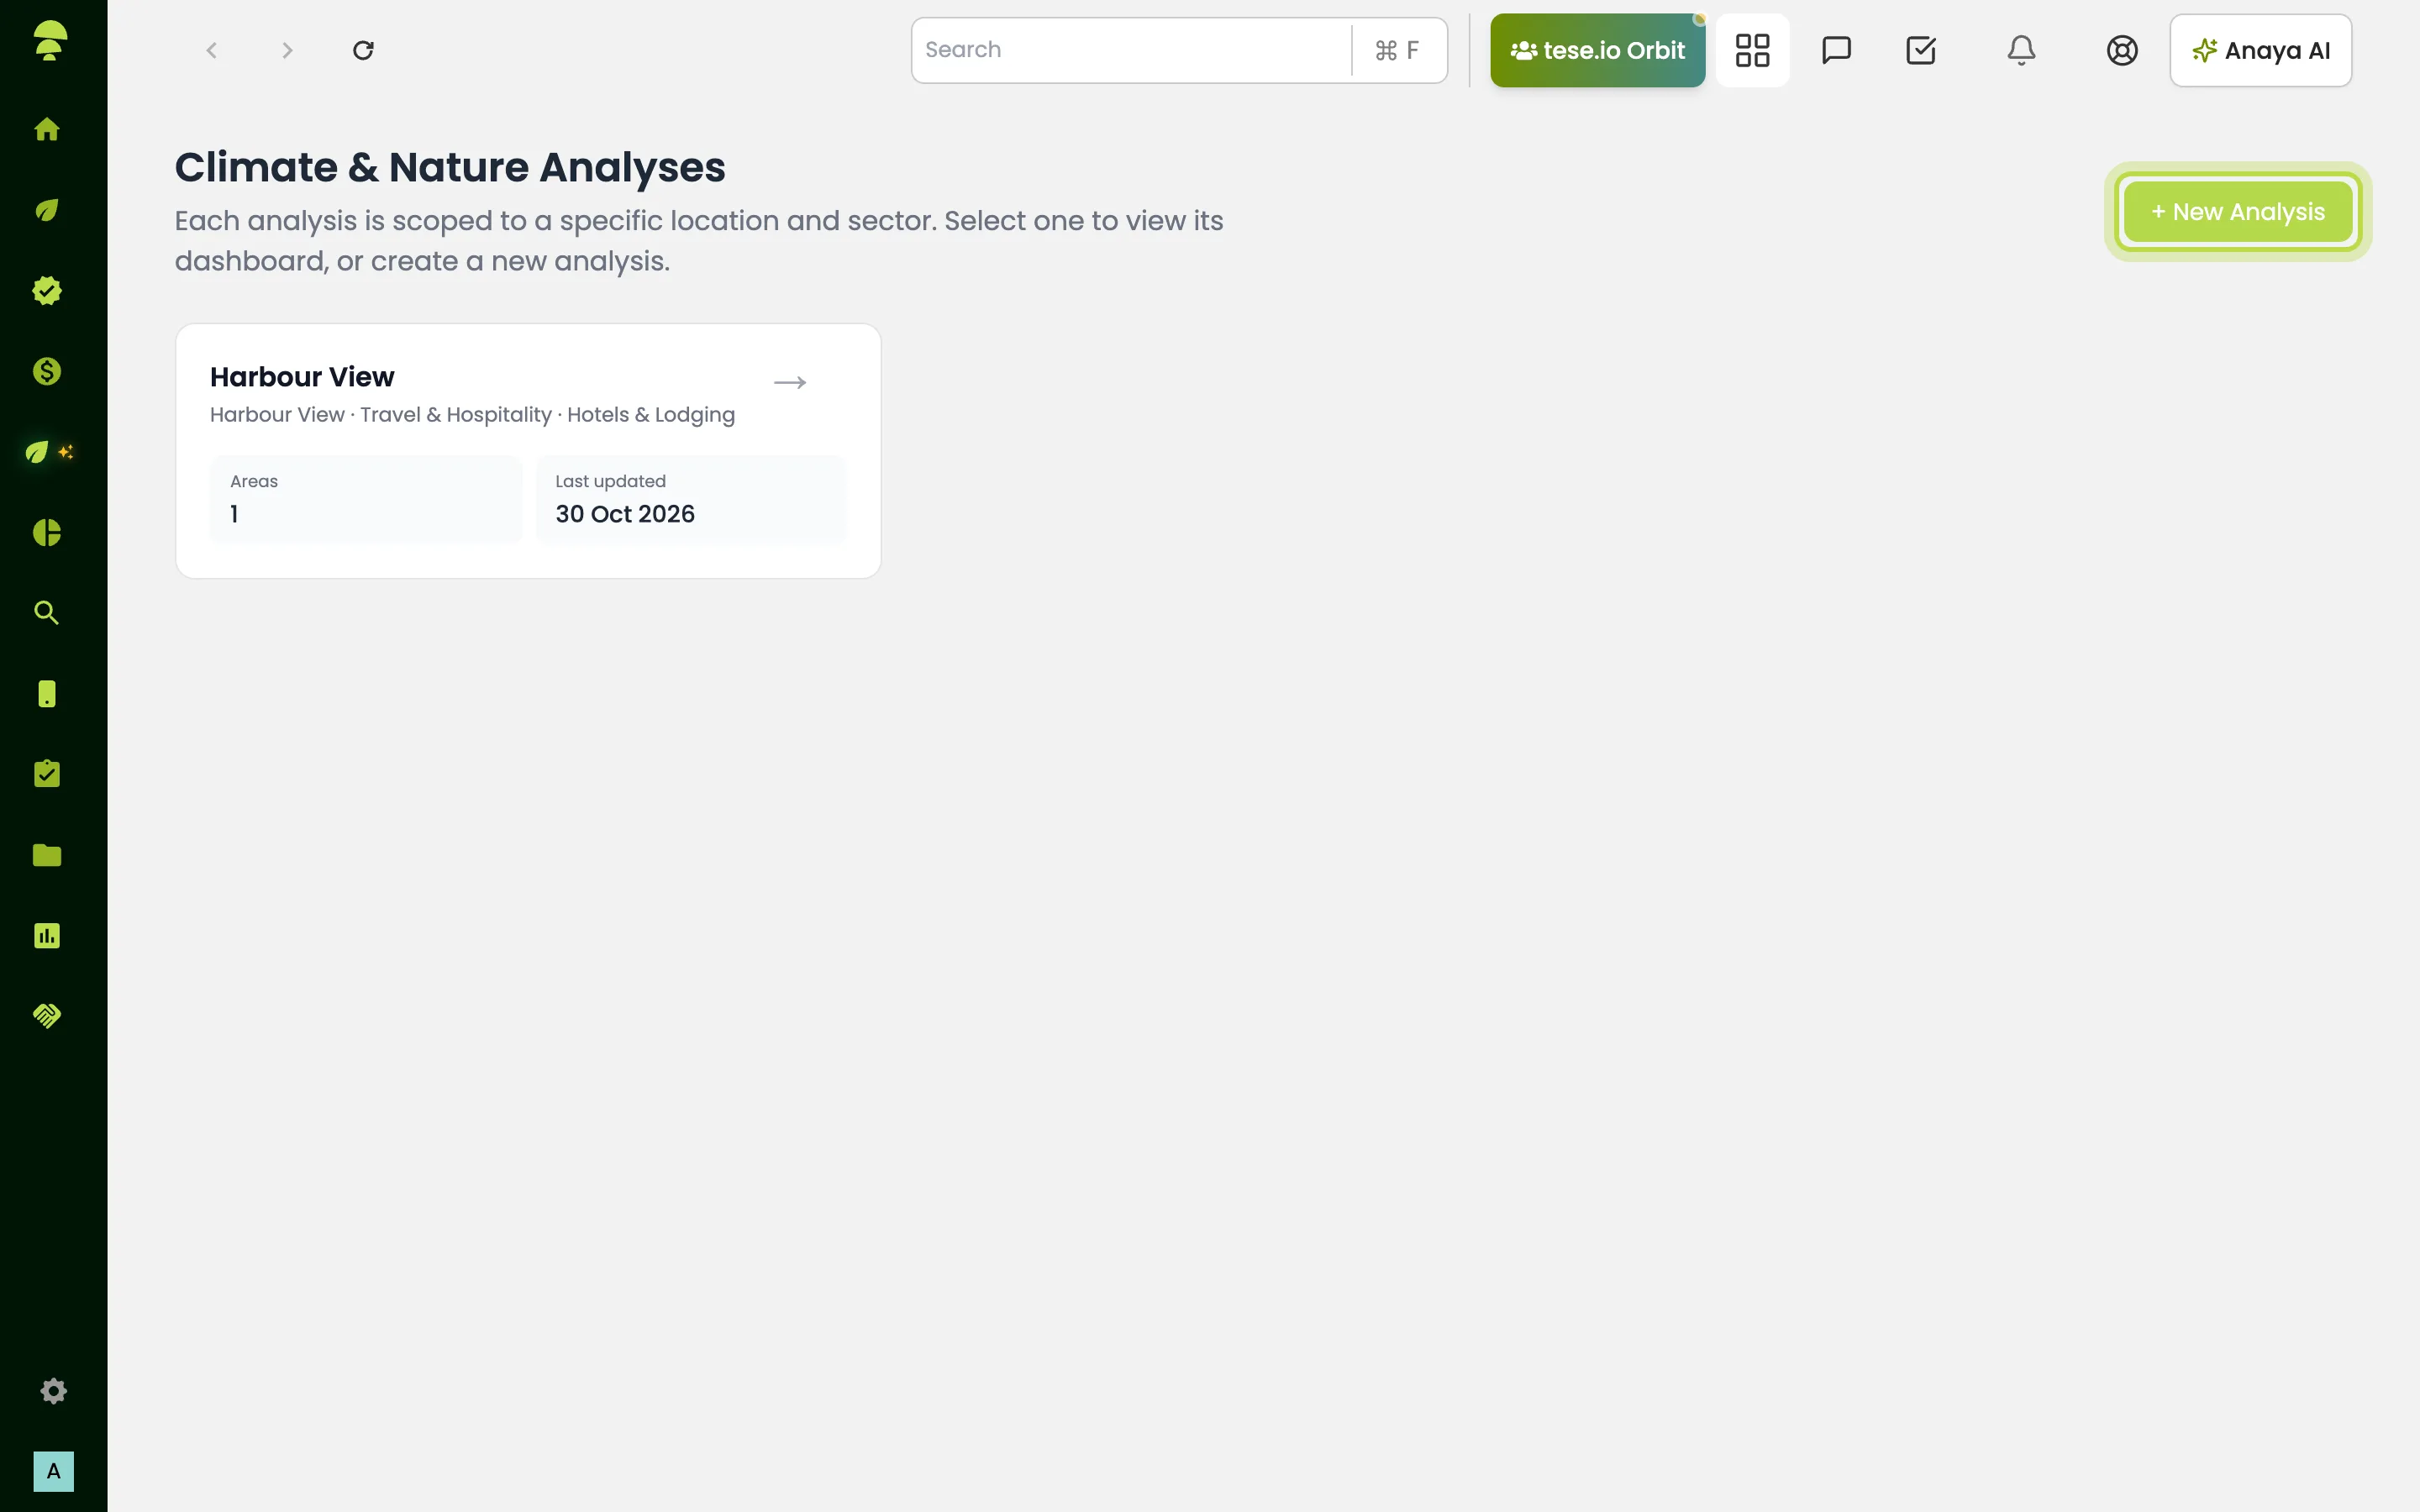
Go to CN Intelligence → Climate & Nature and select + New Analysis (or Create first analysis if you have none yet).
Enter an Analysis Name that you will recognise later, for example the location name plus sector.
Select Import from company profile and choose the location or locations to link. Locations that match your sector are pre-selected.
Check Company Name, Country, Sector, Industry and any other fields shown. Agriculture profiles also ask for crops, livestock and farm size.
Select Save & Analyse Risks. The button stays disabled until the analysis has a name and a linked property.
An analysis needs a mapped site boundary. If your location has no drawn area, add one in Settings → Area Management first, then import it.
How to use the property dashboard
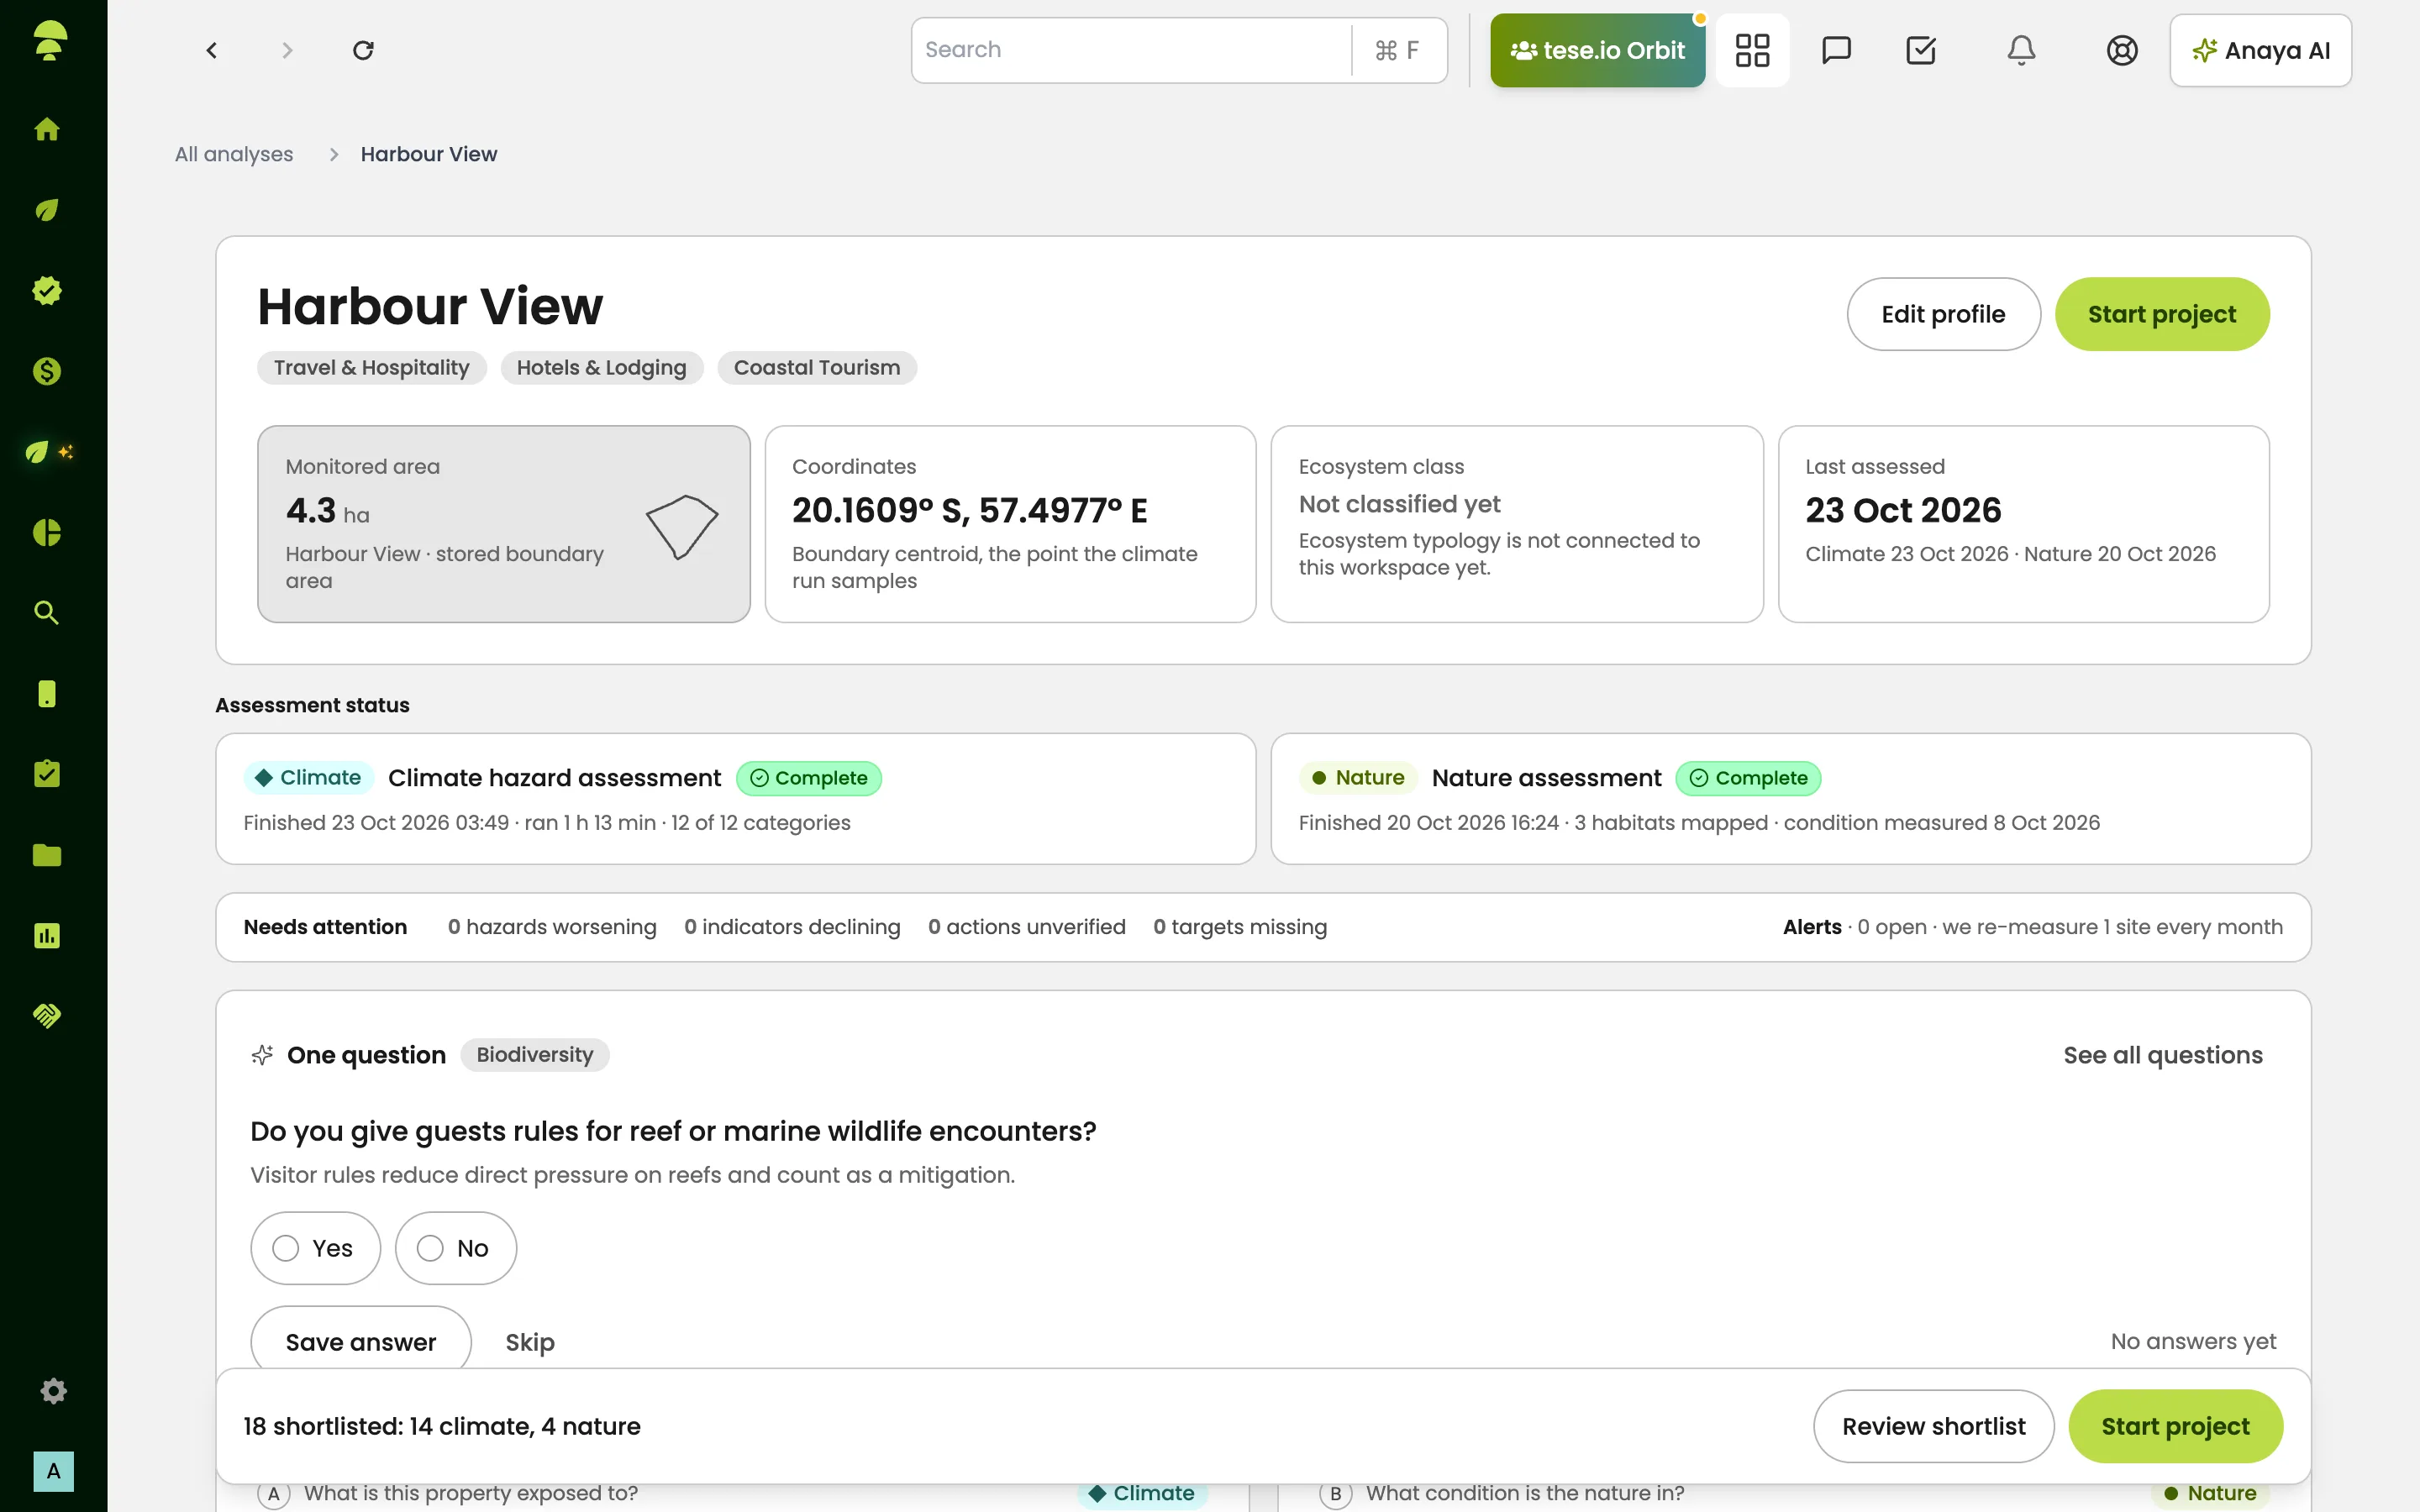
Select an analysis card to open its dashboard. The breadcrumb reads All analyses › your analysis name.
Check the Assessment status strip. It shows the Climate hazard assessment and the Nature assessment. Depending on setup, both start automatically when you open the dashboard, or you start each one with Start assessment or Start mapping.
You can leave the page while they run. Results appear when each run finishes. If one fails, use Retry.
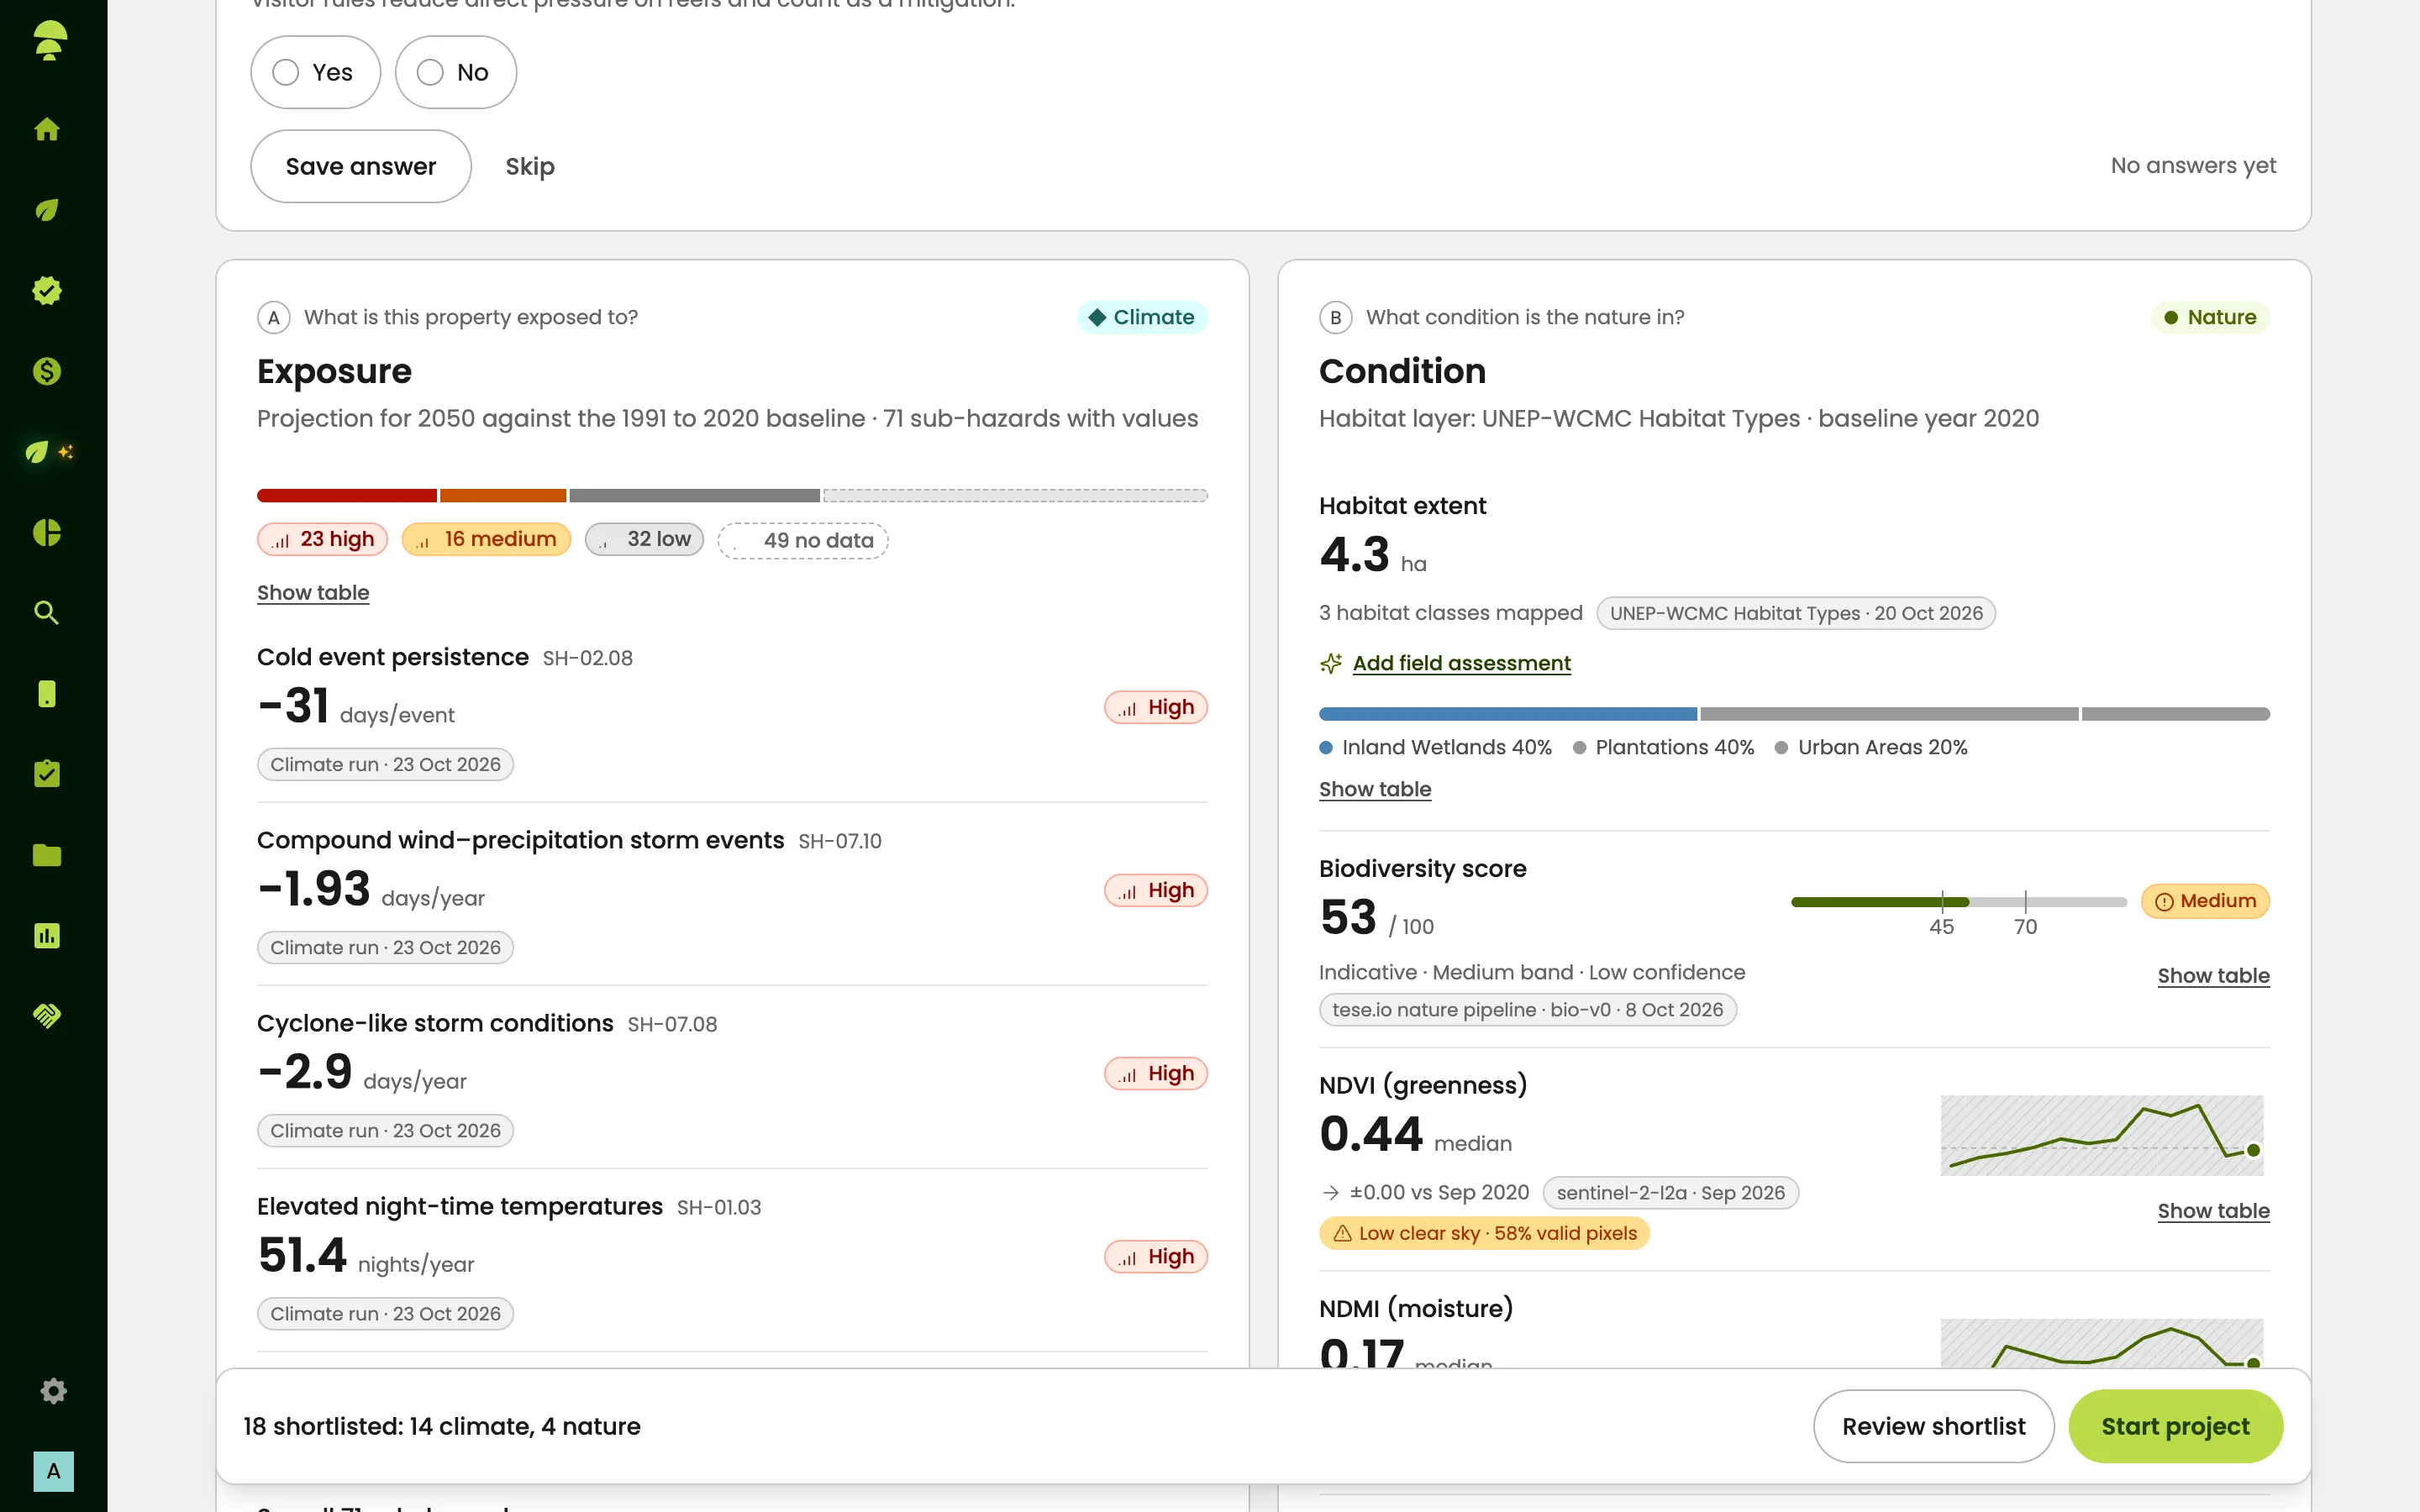
Read the question blocks: What is this property exposed to? (climate hazards), What condition is the nature in? (habitats and condition) and What does it mean financially? (financial translation).
Use Review hazards, Open habitat or View habitat map to go deeper.
Check Alerts and Needs attention for items to acknowledge or dismiss.
How to go deeper on climate or nature
Each analysis has two tracks, each with an Analysis step and a Strategy step:
Climate hazards lists hazard categories such as heat stress, flooding, drought, wildfire, storms and sea-level rise, with the sub-hazards for the selected property. Use Re-run Analysis to refresh it.
Climate strategy suggests recommended activities for those hazards.
Biodiversity analysis maps the habitats inside your site boundary. Where enabled, it also measures their condition from satellite imagery.
Biodiversity strategy suggests strategies matched to the habitats found. Run the biodiversity analysis first.
From a strategy you can select Start project to turn it into a project in ESG Manager. Projects linked to the analysis are listed under Projects from this profile.
Evidence
On some organisations, the property dashboard has an Evidence tab and card. A scan checks open data sources for the site (for example protected areas, species records, forest change, land cover, water and, for coastal sites, reef and ocean heat stress). It then matches what it finds to the metrics of a framework you choose. Results are sorted into three tabs:
Found for you – answers taken from open data or from your Climate & Nature analysis.
Check these – suggestions waiting for you to review.
We need you – metrics you must answer or Add manually.
If you already answered a question by hand, your answer is kept. Where the evidence lane is not switched on, the same job is done by Data Bridge, and Nature Context gives a single map of the nature around your site.
Good to know
Each analysis covers one location and sector. Create separate analyses for different sites.
Deleting an analysis permanently deletes its areas, risks and biodiversity data.
Carbon Governance on the dashboard leads to carbon project tracking, if your organisation runs carbon projects.
CN Tools holds tools such as MapBiomas Explorer Brazil and Carbon Emissions Explorer.
Common questions
Why is Save & Analyse Risks greyed out? You need an analysis name and a linked property. Select Import from company profile and pick a location with a mapped area.
The dashboard says the profile has no mapped site. What do I do? Draw the site boundary in Settings → Area Management, then reopen the analysis.
How long does an assessment take? It runs in the background. You can leave the page, and results appear when each run finishes.
I can't see the habitat condition figures. Condition measured from satellite imagery may not be enabled for your organisation — ask your tese.io contact.
Where did Data Bridge go? When the Evidence lane is enabled, Data Bridge and Nature Context are replaced by the Evidence tab on each analysis. Old links take you there.
Can I turn a strategy into a project? Yes. Select Start project from the strategy. The project is created in ESG Manager and appears under Projects from this profile.
Was this article helpful?
Still need help?
The tese.io team reads every message and usually replies within one working day.
Contact support