
Dashboards, analytics and widgets
What the Home page and ESG Manager overview show, and how to analyse activity data and pin charts as widgets.
tese.io gives you three places to see your figures at a glance: the Home page, the ESG Manager → Overview page, and the Analytics tools inside Activities Data, where you can build charts and pin them as widgets.
Where to find it
Home — the first item in the left-hand menu.
ESG Manager → Overview.
ESG Manager → Activities Data, then the Analytics tab. Each activity also has its own Overview and Analytics tabs.
The Home page
Home greets you and gives a summary of your workspace:
An attention strip for active anomalies and overdue tasks, with a Review link for each item. You can dismiss items.
Finish setting up your workspace for new organisations that have not yet set a financial year.
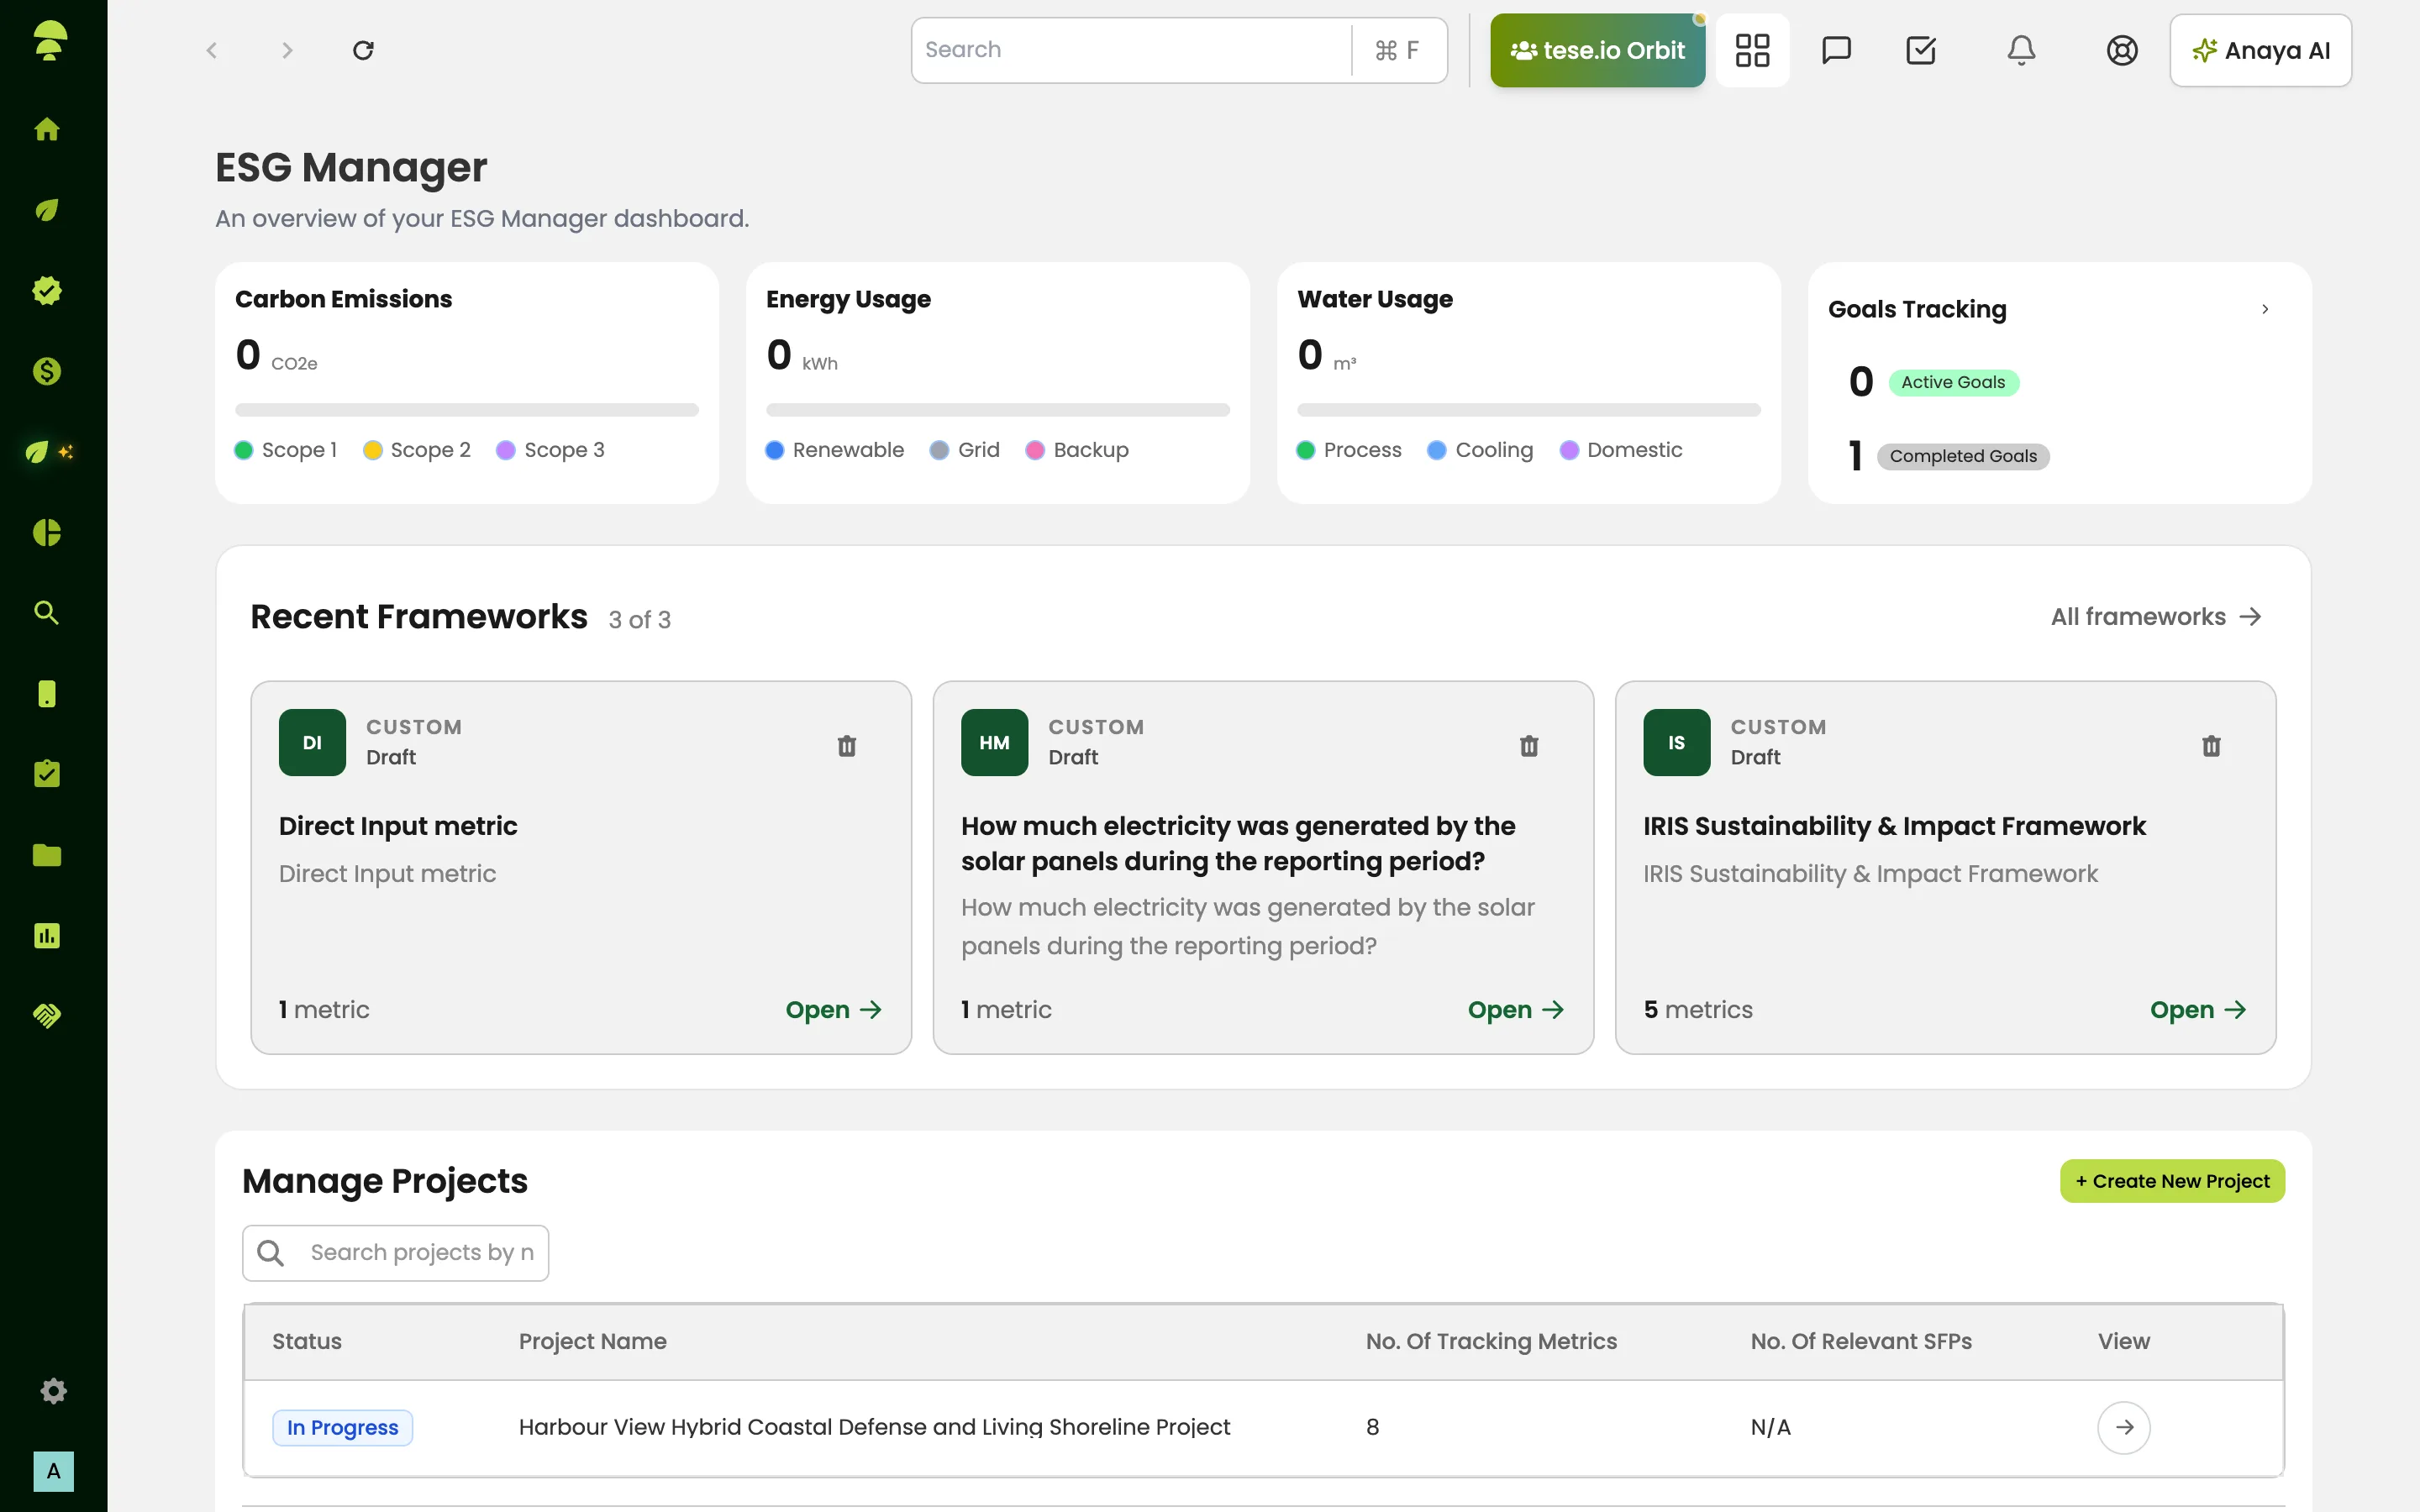
KPI cards: Carbon Emissions (split into Scope 1, 2 and 3), Energy Usage, Water Usage and Goals Tracking. When there is no data yet, a card tells you what to do next, such as Add activity data, Connect a device or Set a target.
Pick up where you left off, showing pages you recently opened and your shortcuts.
Outstanding tasks, when you have some, with View all.
Sections for reports and sustainable finance, depending on your access.
How to change your shortcuts
On Home, select Edit shortcuts.
In Edit quick links, add a link from Choose a link to add… or remove ones you don't need.
Select Save. Only links to modules you can access are shown.
ESG Manager → Overview
The overview page shows headline cards for carbon, energy, water and goals, your Recent Frameworks (open one, or remove it from your workspace), and Manage Projects with a list of projects and a + Create New Project button.
How to analyse activity data
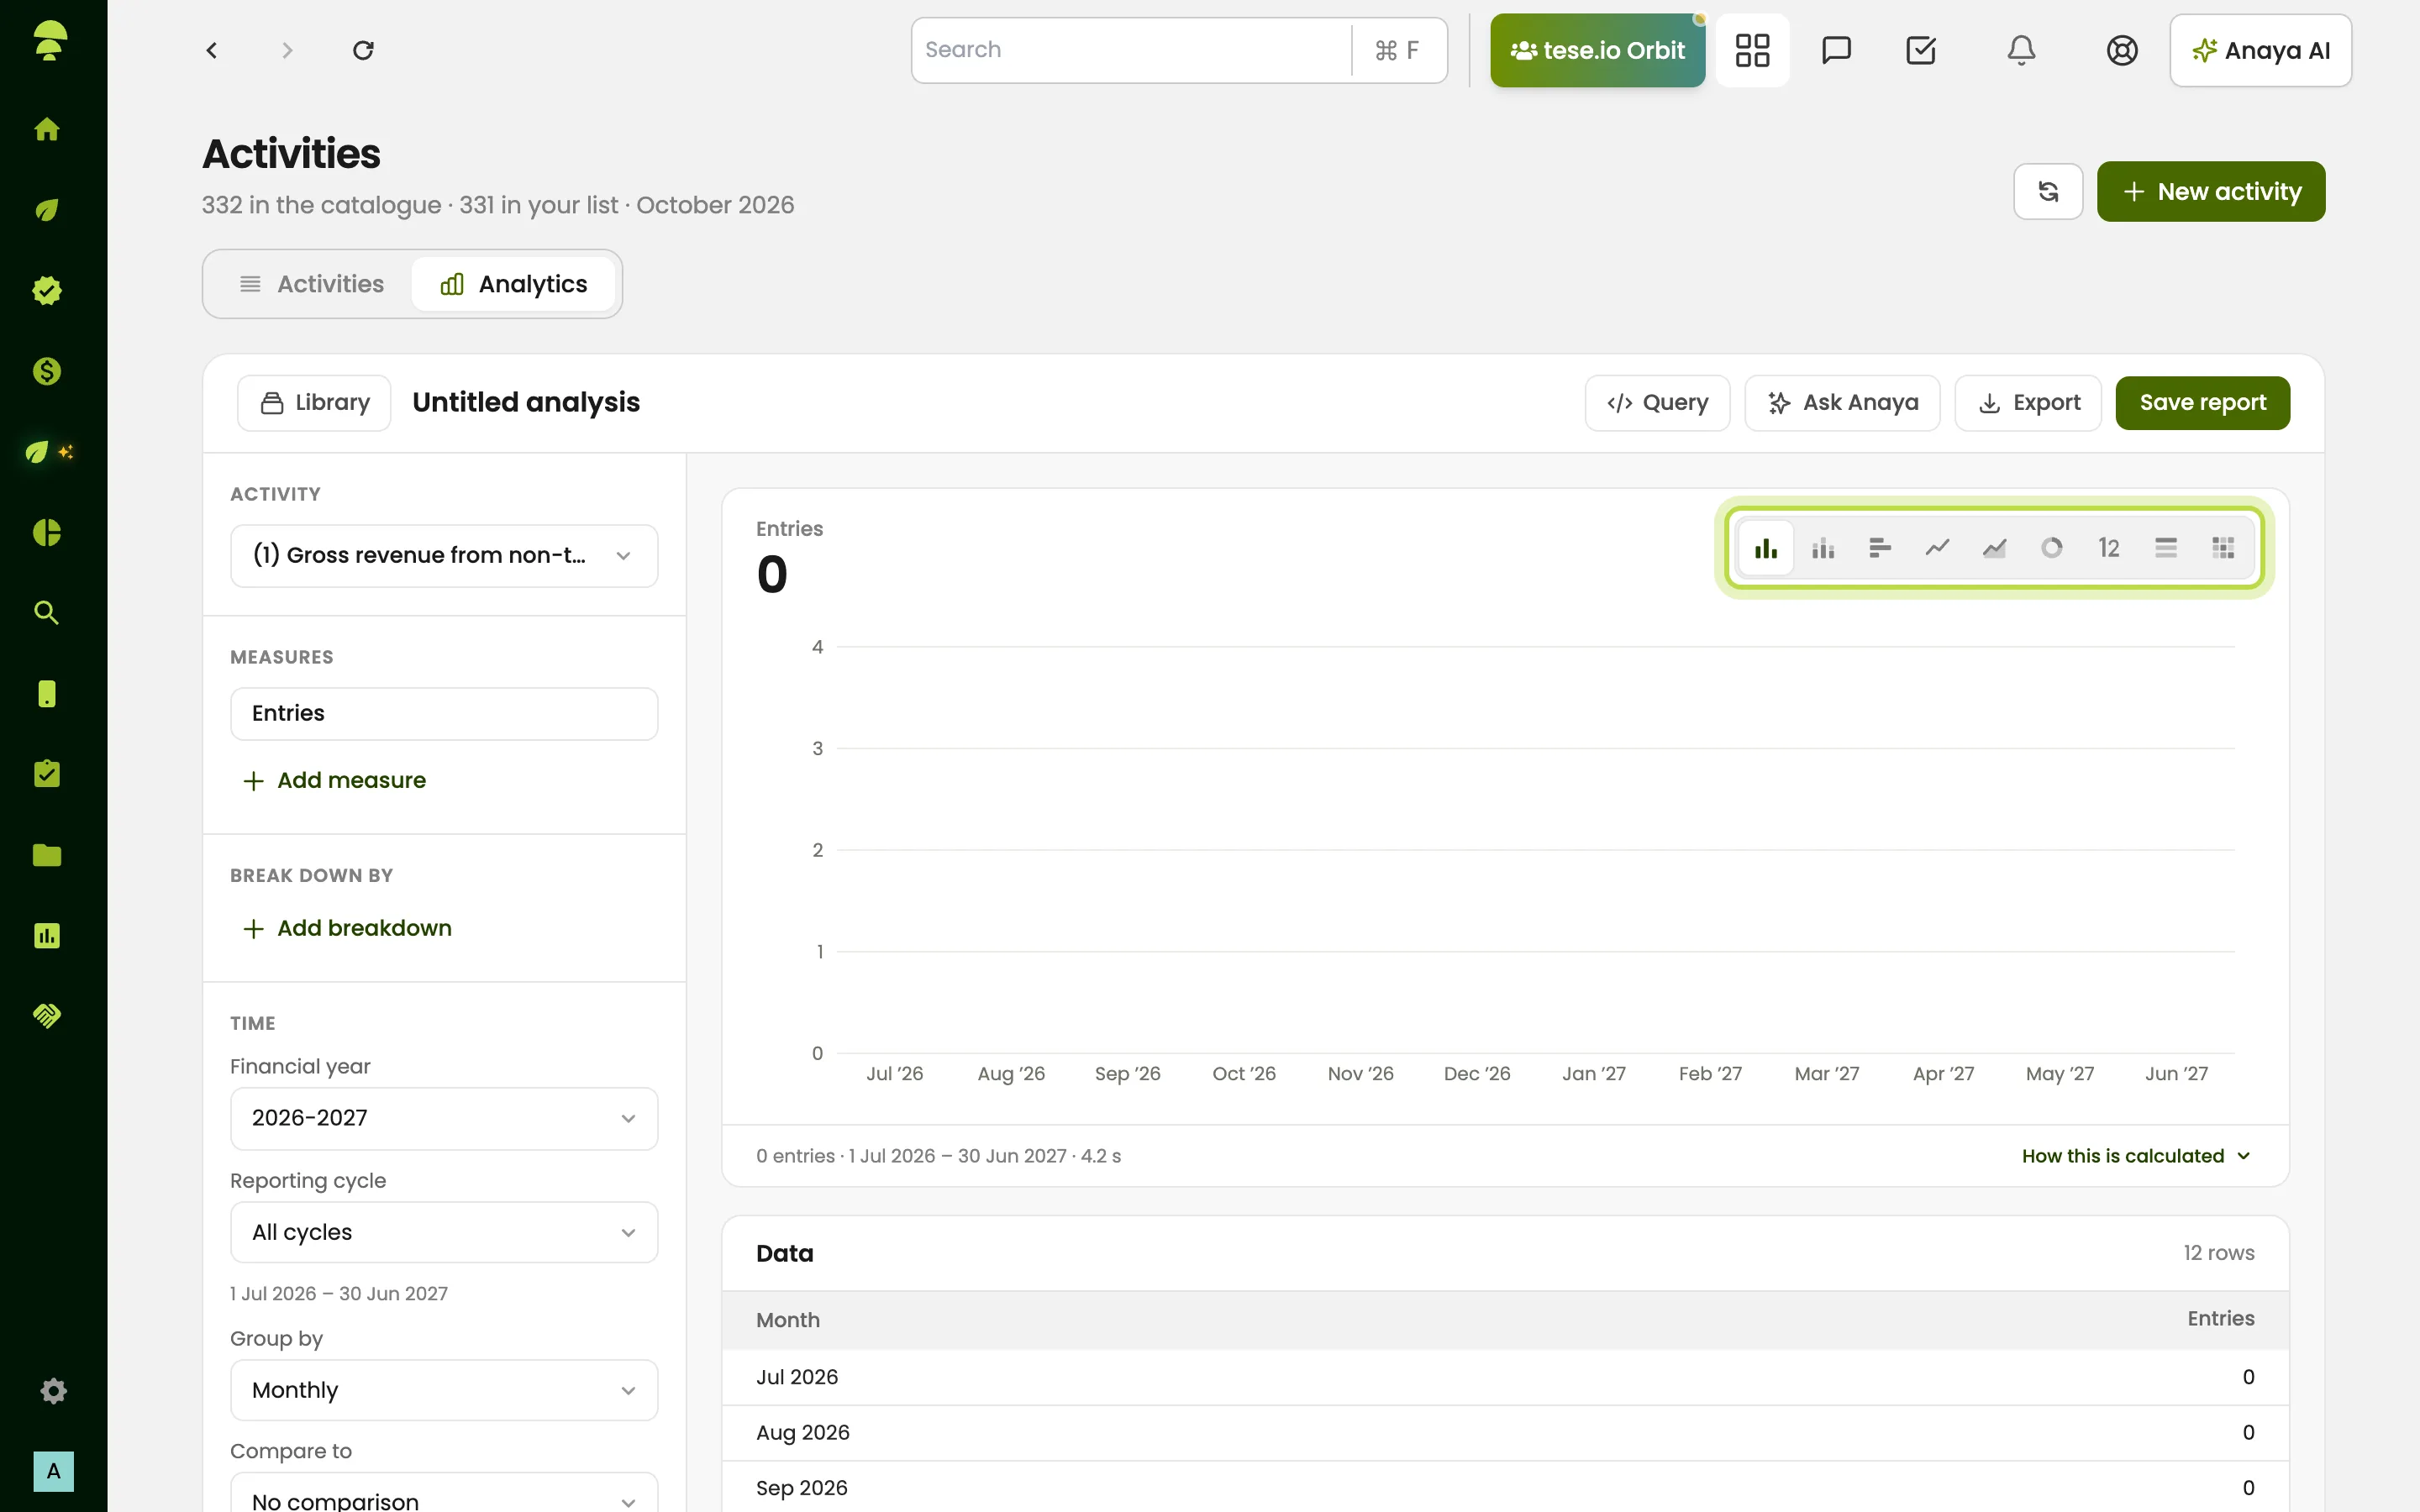
Go to Activities Data and open the Analytics tab.
Use the Library to start from a saved report, a template or an activity.
Build the chart: choose what to measure (for example a total, average or count of entries), how to split it (by site, department, activity, status and so on) and the chart type — Bar, Stacked bar, Horizontal bar, Line, Area, Donut, Number, Table or Heatmap.
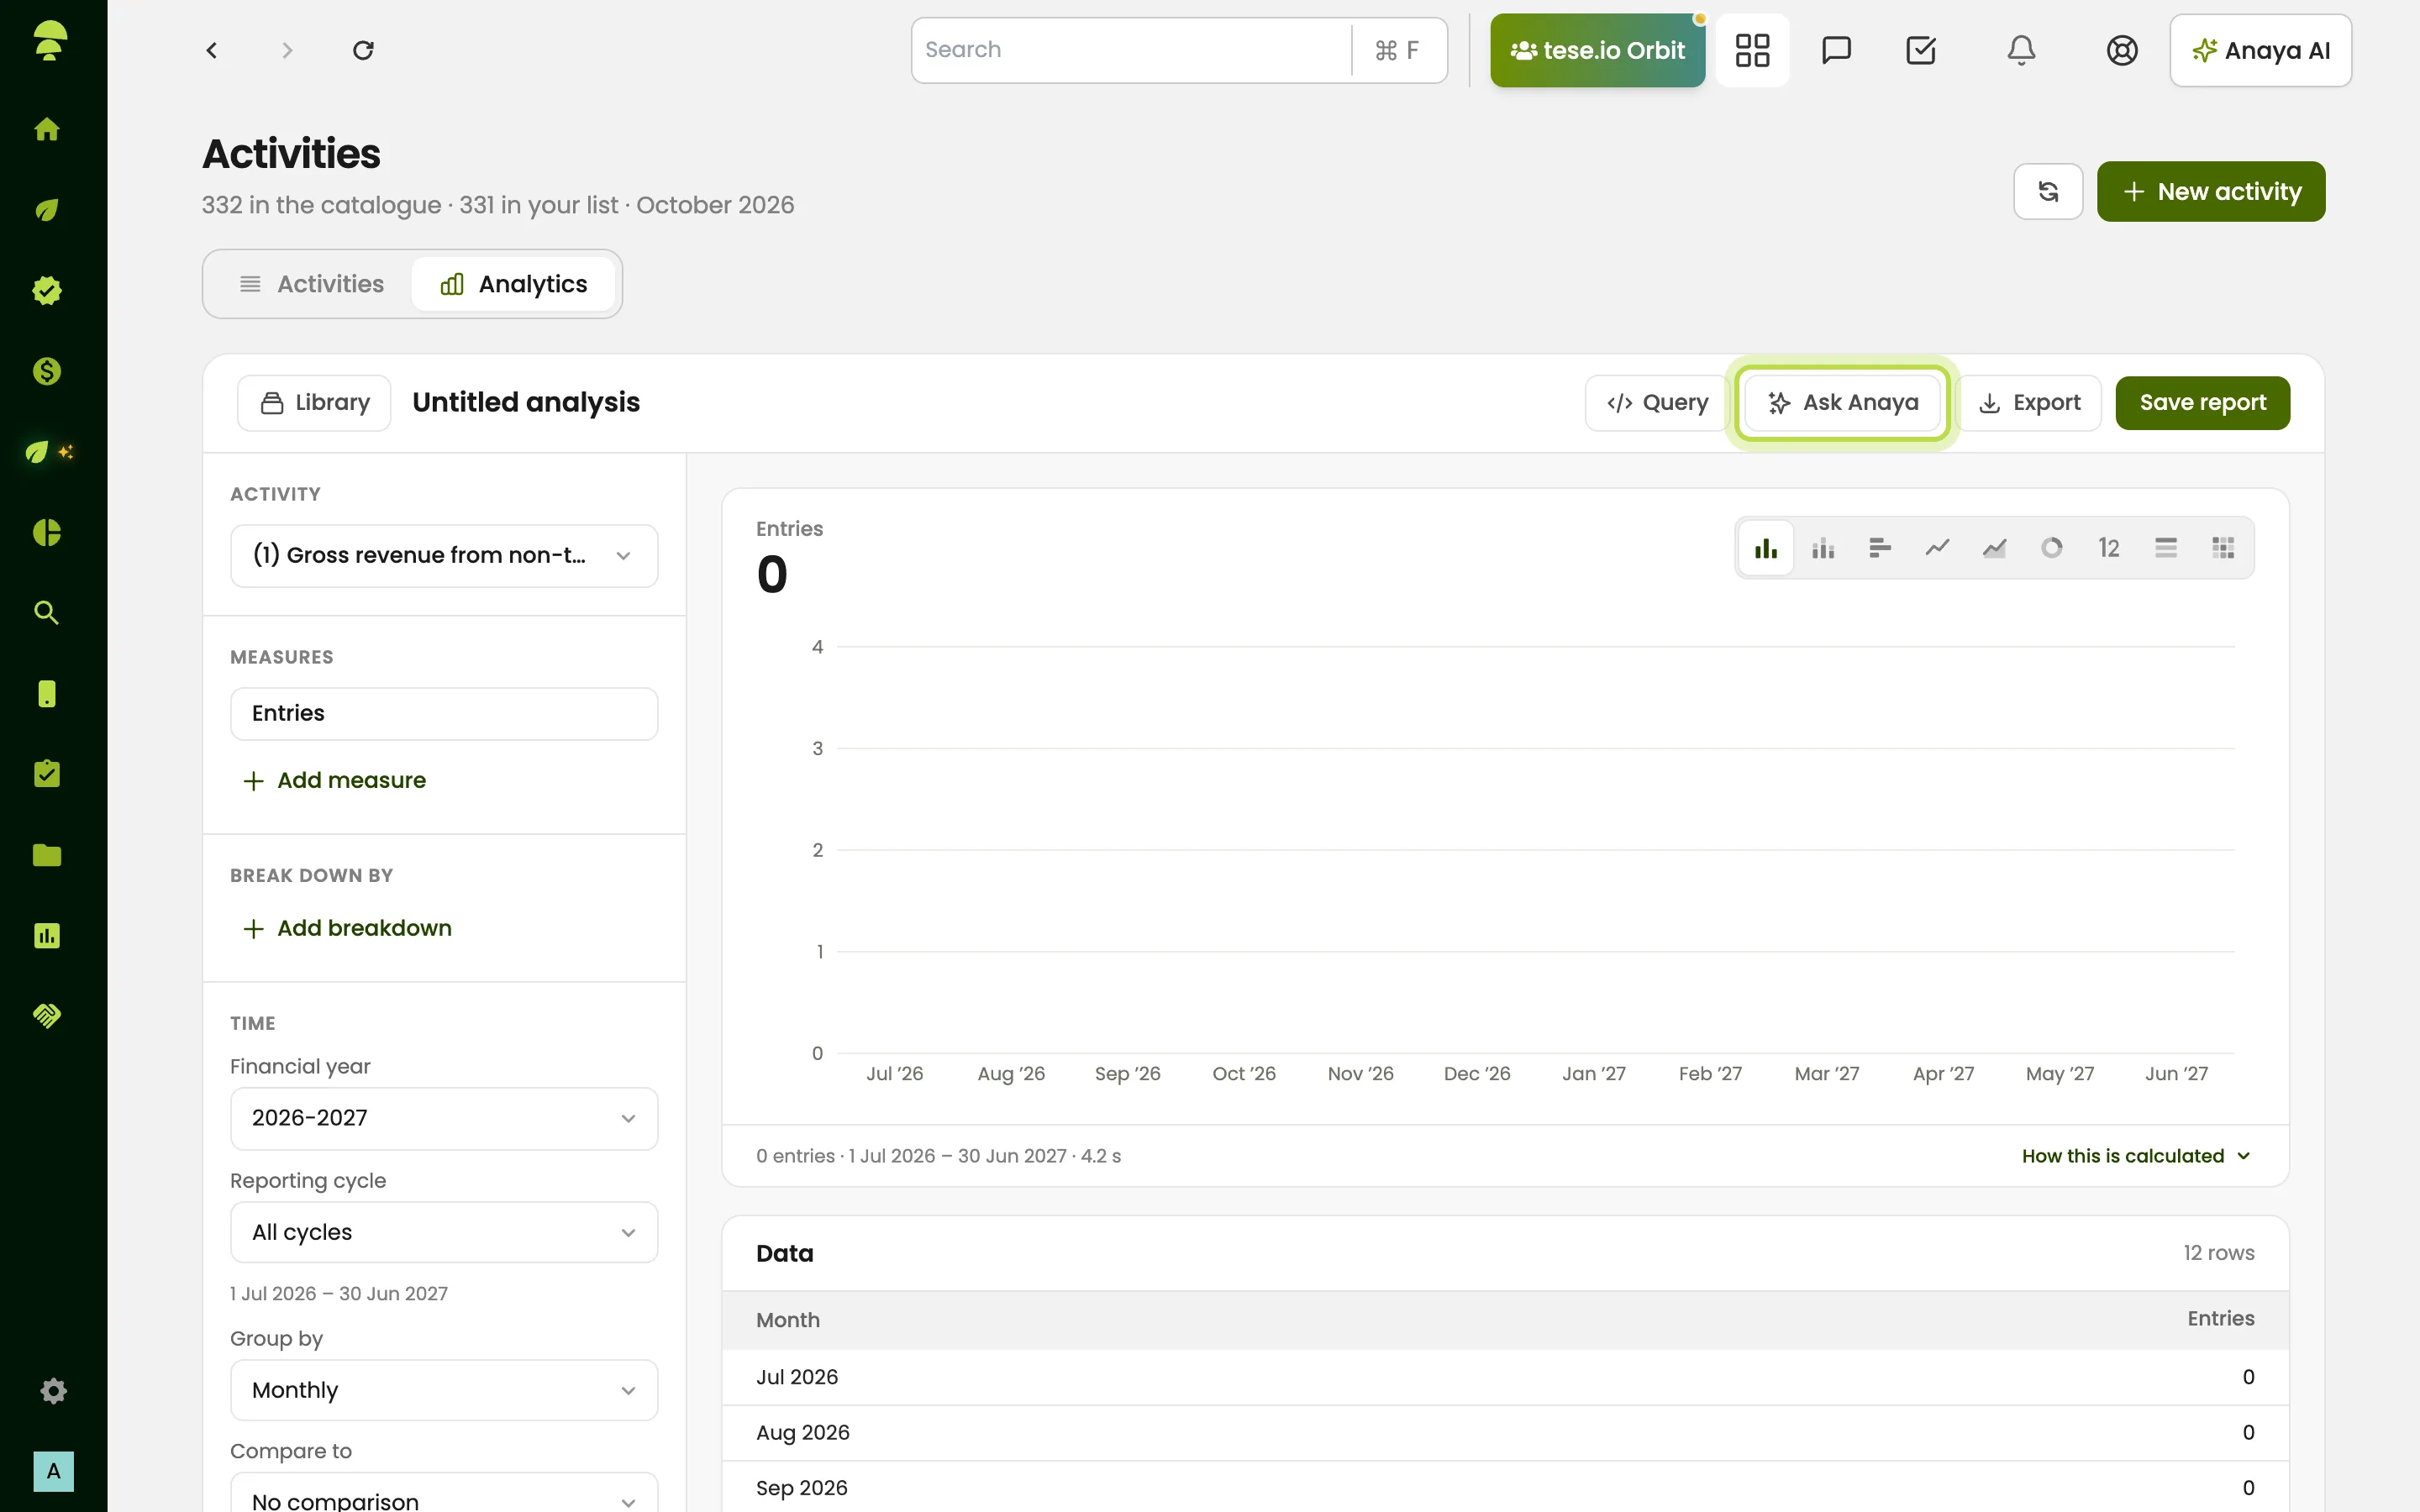
Optionally open Ask Anaya and ask a question in plain words, such as "Which sites used the most electricity this year?". Anaya writes the query for you. This uses AI credits.
Save your work as a report. Saved reports keep the query, not the numbers, so they always show current data. Colleagues who open it see only the sites they have access to.
How to add widgets to an activity
Widgets are live charts that sit on an activity's Overview tab.
Open an activity from Activities Data.
On the Overview tab, find Widgets and select Add widget (or Add your first widget).
In the Widget builder, give it a Title, pick a Visual (Number, Bar chart, Line chart, Breakdown or Table), the Field and Calculation, the Period (this year, last year, last 12 months, this quarter or a custom range), and optionally group or split it by site or department. Choose a Width.
Check the Preview, then Save widget.
To pin a chart you built in Analytics, select Add widget there; it is added to the activity's Overview.
Use the arrows on a widget to move it earlier or later, or the edit and delete buttons to change or remove it.
Good to know
Everyone who can open an activity can see its widgets. Only people allowed to assign others to activities (the Department hub assignment permission on their role) can add, edit, reorder or delete them.
An activity can hold up to 24 widgets.
Widgets can count all submitted entries, approved entries only, or include drafts.
What you see on Home depends on the modules your role can access.
Common questions
Why does a KPI card on Home say "Add activity data" instead of a number? There is no data for it yet. Follow the card's button to add data or connect a device.
I can't see Add widget on an activity. Your role does not have permission to build widgets. Ask your administrator.
Do saved Analytics reports update automatically? Yes. They store the question, not a snapshot, so they always show current data.
Can I ask Anaya to build a chart for me? Yes. Open Ask Anaya in the Analytics tab and describe what you want to see.
Was this article helpful?
Still need help?
The tese.io team reads every message and usually replies within one working day.
Contact support